This group includes eight interactive tools aimed at illustrating the concept of frequency response and its analysis for the same systems treated in the previous group. The main graphical representations associated with this concept are also introduced, as well as an interactive tool for fitting models from Bode diagrams obtained experimentally.
Frequency response concept
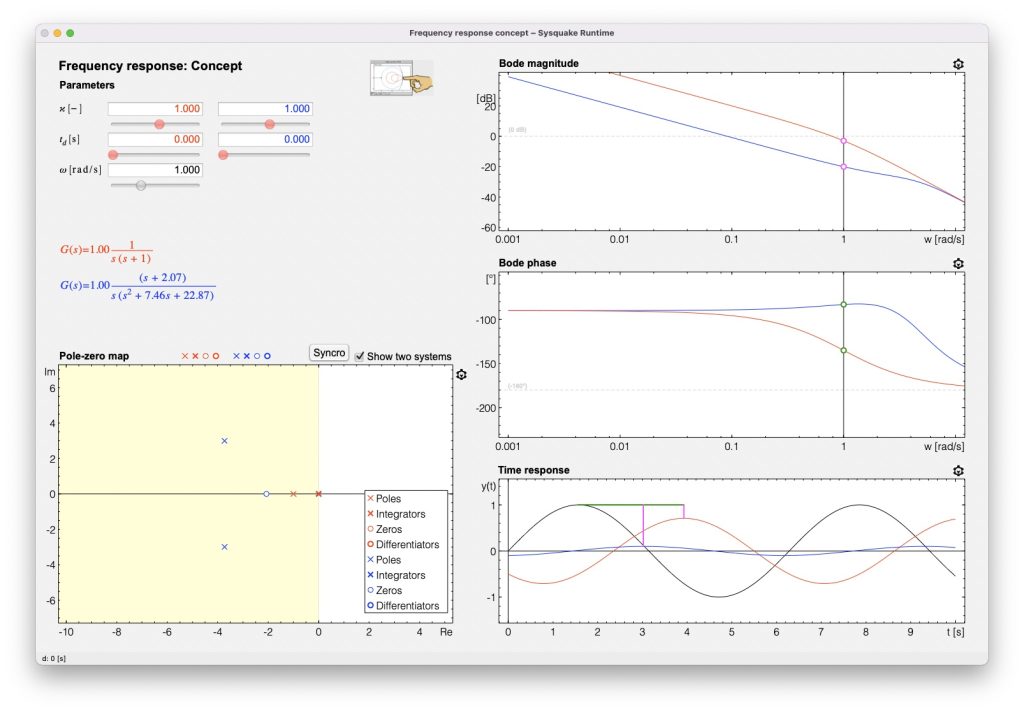

The main objective of this tool is to analyze the frequency response concept and related graphical representations (Bode, Nyquist and Nichols diagrams). The time domain response to sinusoidal inputs of different frequencies in steady-state regime is shown together with those graphical representations, to facilitate the interpreta- tion and understanding of the main concept.
Frequency response of continuos-time first-order systems without zeros
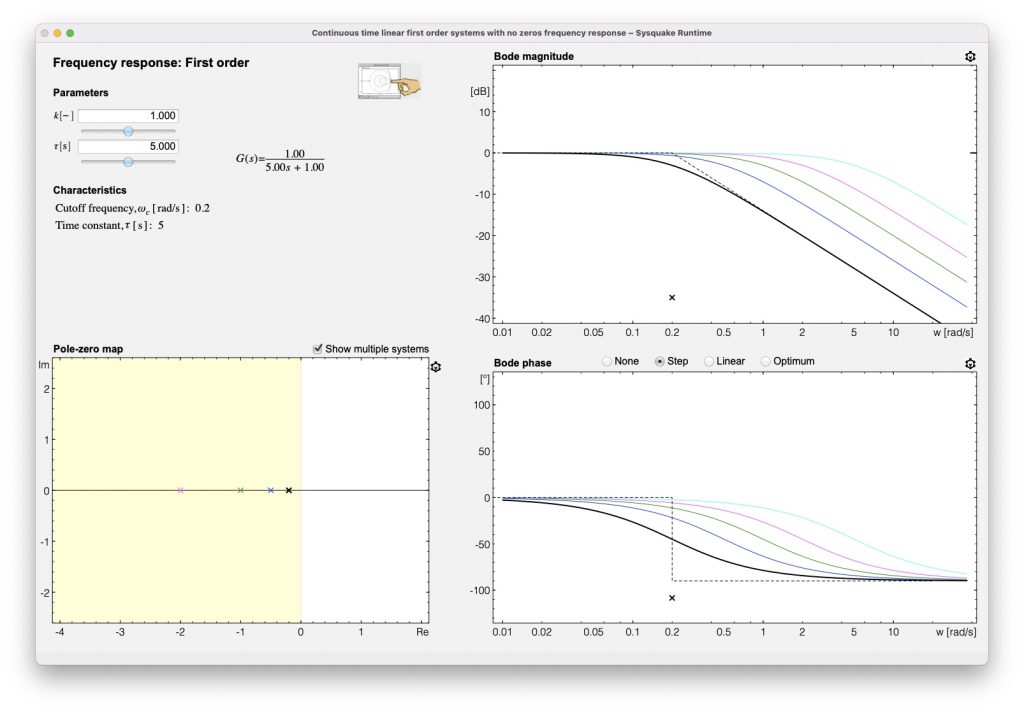
This interactive tool is devoted to analyzing the frequency response of first-order transfer functions. The transfer function is represented in time constant format and the tool helps to analyze the effect of static gain and time constant (or equivalently, the pole location) on the Bode magnitude and phase diagrams. Although there is a tool focussing on NMP systems, this tool also allows the introduction of negative static gains and time constants (pole in the RHP) to verify the effect in the phase plot.
Frequency response of continuos-time second-order systems without zeros
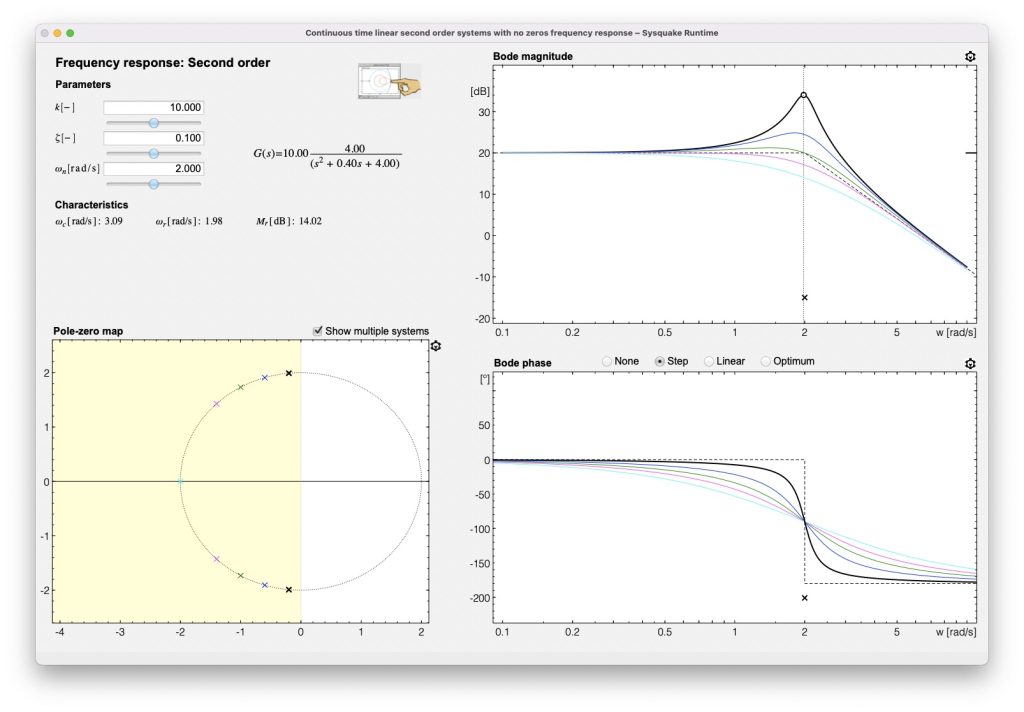
The main objective of this card is to analyze the frequency response of second- order LTI systems according to the values of the parameters of their descriptive transfer functions. Representative frequencies can be determined, together with the main values of magnitude and phase at those frequencies. Bandwidth and corner frequencies can also be determined.
Effect of a zero on the frequency response of continuos-time first-order systems
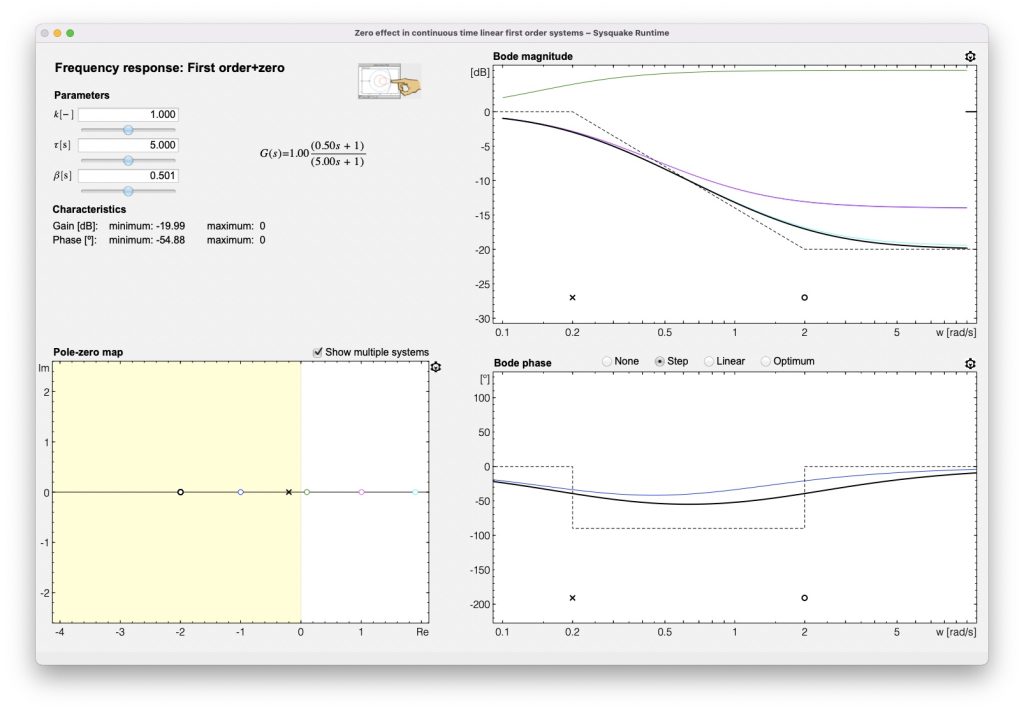
This tool analyzes the effect of a zero in the frequency response of first-order LTI systems. The concepts learned here are very useful also for designing lead-lag compensators in the frequency domain.
Effect of a zero on the frequency response of continuos-time second-order systems
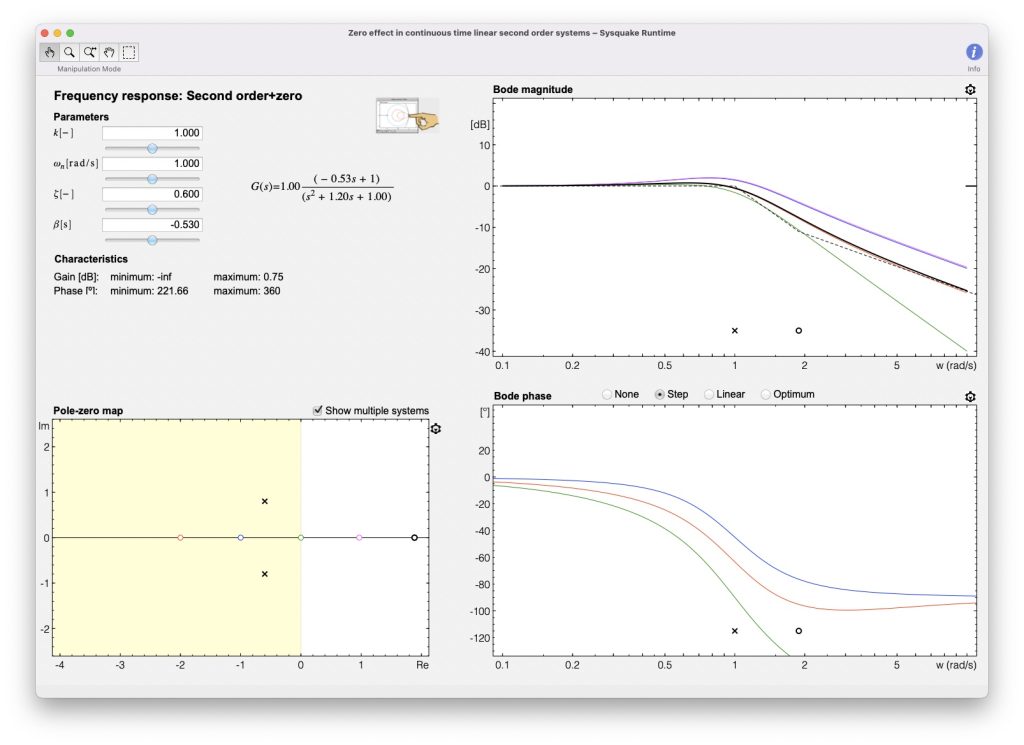
This interactive tool helps to analyze the Bode diagram of a second-order transfer function with a zero, both in the underdamped and overdamped cases. It is quite interesting to analyze how the frequency response is influenced by the relative position between the poles and the zero in the MP case and also how a zero in the RHP makes the system NMP.
Frequency response of generic continuos-time linear systems
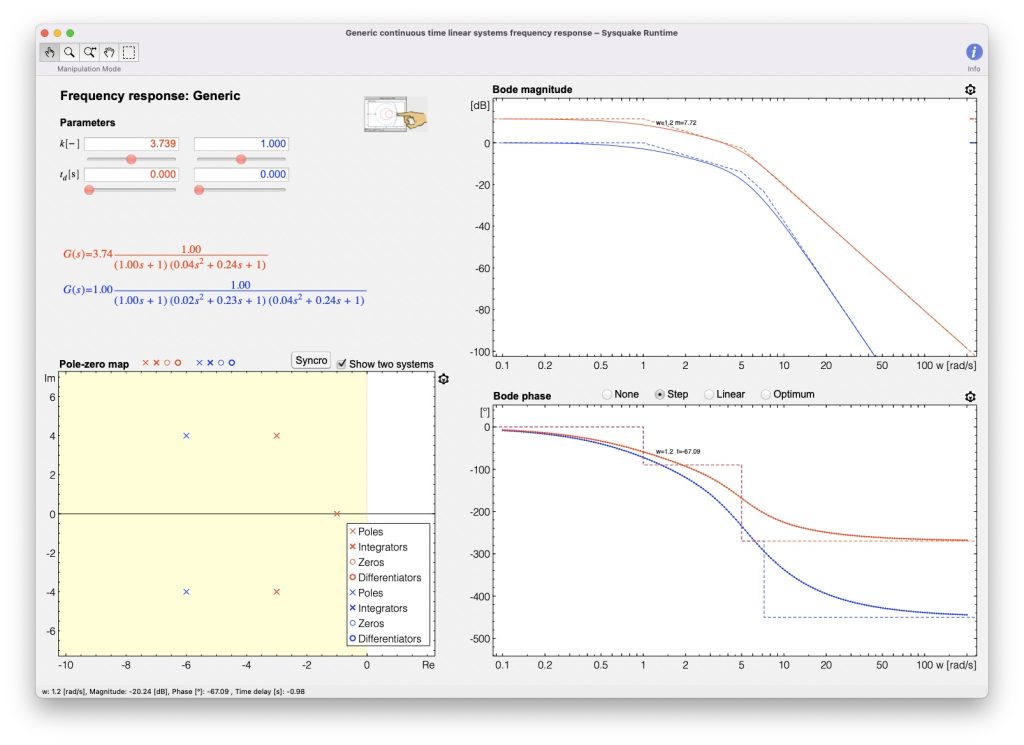
This tool facilitates the analysis of the frequency response of generic systems, with an arbitrary number of poles and zeros, including integrators and differentiators and dead time. Comparisons among different configurations can be easily performed.
Nonminimum phase systems
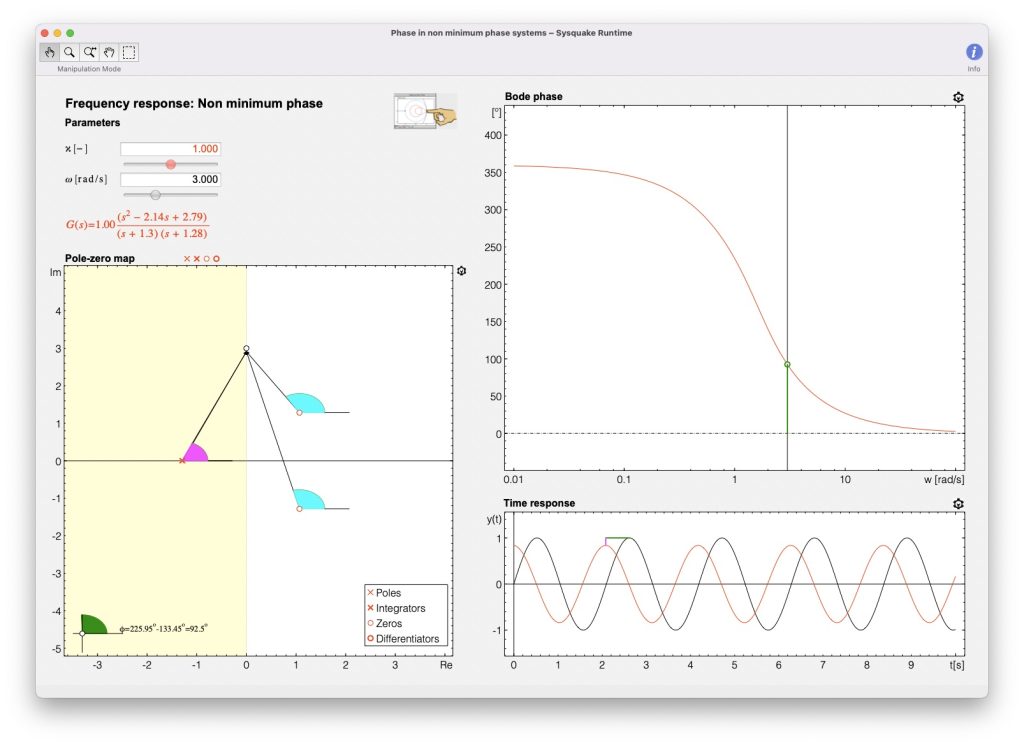
This tool is devoted to analyzing in the frequency domain how to obtain the phase of NMP systems in a visual way.
Model fitting in the frequency domain
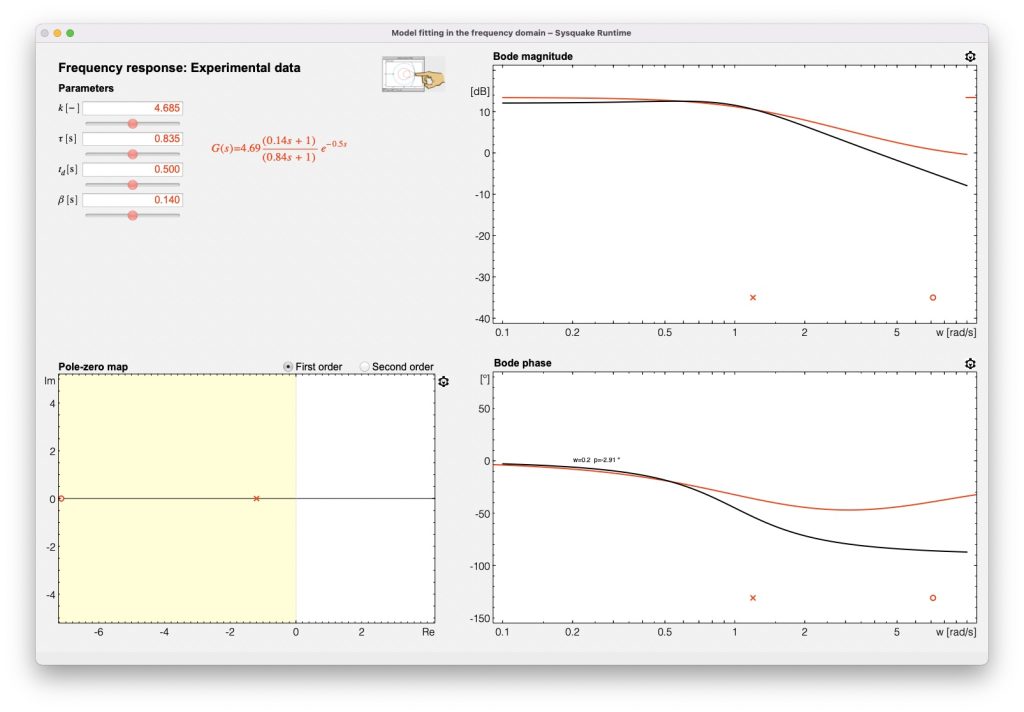
The frequency response of a system can readily be obtained experimentally by exciting the system with sinusoidal input signals about a particular operating point. Corresponding points on the Bode diagram can be drawn from the amplitude and time shift of the output response in steady-state (converting the quotient between the output and input magnitude to dB and the time shift to phase shift through the corresponding frequency). Then, asymptotic approximations help to interpolate these points and to identify system transfer functions from the experimental Bode dia- grams. The interactive tool presented in this section helps to estimate these transfer functions using in this case first or second-order structures (which may include time delay and a zero).